Trade & Sourcing
Malaysia Looks Lower-Duty Than Japan Until Both Use the Same Mix of Product Families
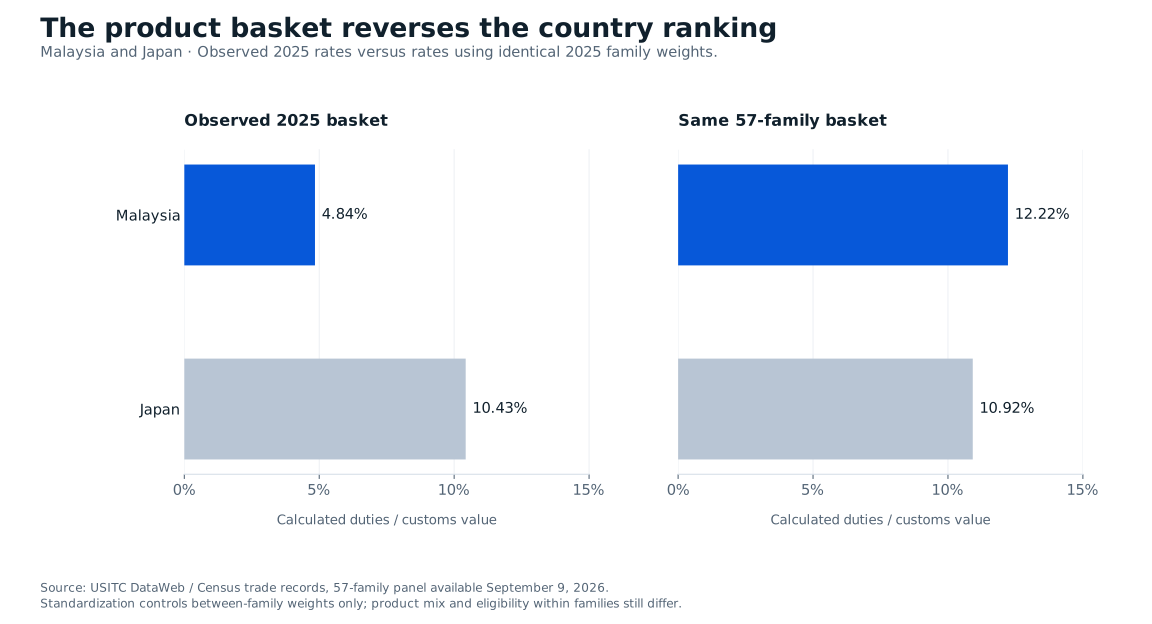
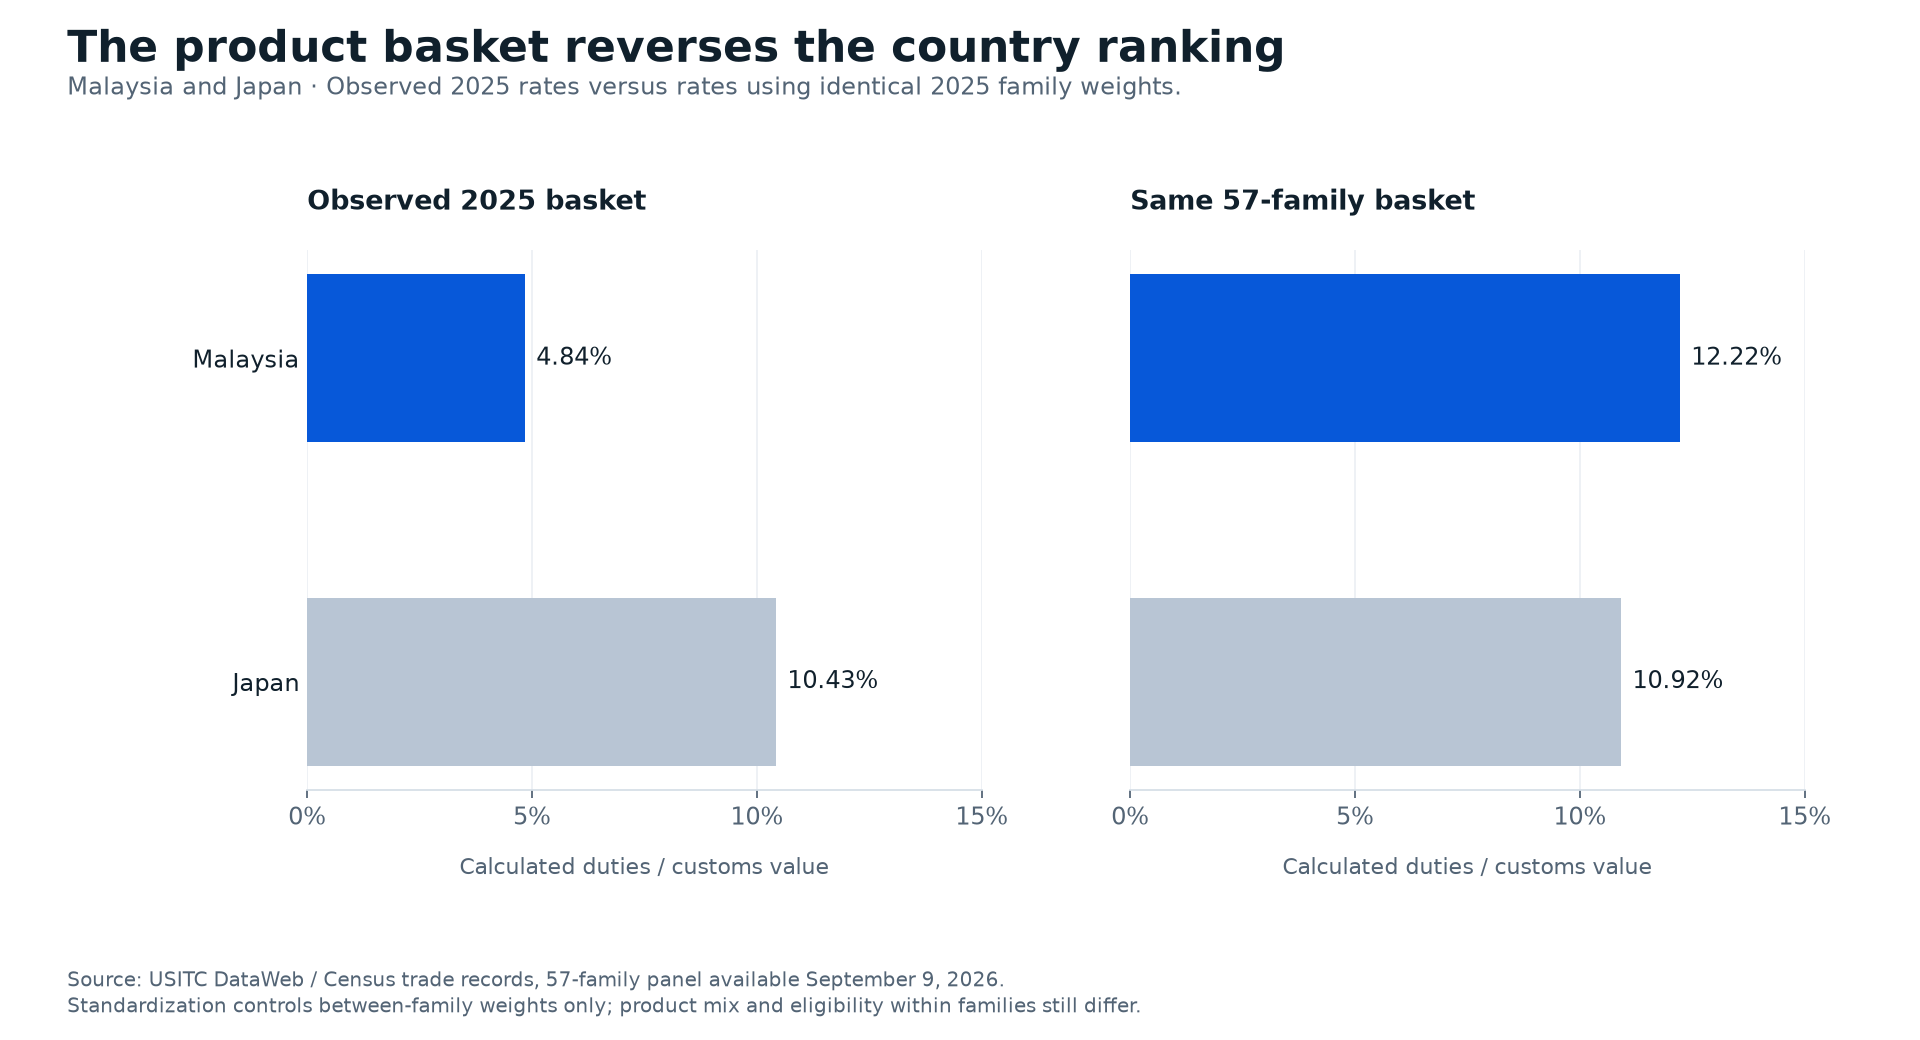
Malaysia’s observed 2025 rate is 4.84% versus Japan’s 10.43%. Reweighting each country’s 57 family rates to the same panel basket reverses them: 12.22% versus 10.92%.
Editorial evidence cutoff: September 9, 2026. Published September 29, 2026. Observation periods are stated throughout; older figures are retrospective evidence.
Before a September 2026 buyer turns a country ranking into a sourcing recommendation, the comparison needs to survive a basic test: are the countries being judged on the same mix of products? The completed 2025 records available by September 9 allow that question to be tested retrospectively. They provide evidence about an averaging problem, not current offers from interchangeable suppliers.
Malaysia’s recorded duty rate looks much lower than Japan’s in the 2025 manufacturing import data: 4.84% against 10.43%. Read as a country ranking, the difference seems decisive. Give both countries the same product-family weights, however, and the ranking reverses. Malaysia comes out at 12.22%, Japan at 10.92%.
The calculation does not reveal a hidden shipment rate. It reveals how much the original comparison depends on what the United States imported from each country. Two national averages can look comparable while describing very different baskets of goods.
That matters whenever a sourcing presentation turns a country-wide statistic into a claim about a particular component. The low aggregate can belong to a country whose exports to the United States are concentrated in low-rate categories, even though its observed rate for the buyer’s own category is not especially low.
View full-size chart
Scroll horizontally to read every label. Keyboard users can focus the chart area and use the arrow keys.
THE PRODUCTS INSIDE THE COUNTRY AVERAGE
In the tracked 2025 panel, semiconductors account for 63.99% of Malaysia’s customs import value. The observed rate on that Malaysia-semiconductor lane is 0.98%. A large share with a low rate pulls down the overall country average.
Japan’s tracked portfolio is distributed differently. Engines account for 8.65% of value, batteries 8.43%, semiconductor equipment 6.92% and turbines 6.63%. None has anything like the weight semiconductors carry in Malaysia’s portfolio. The raw country comparison is therefore partly a comparison of those different product distributions.
These observations come from complete family-country records in the saved USITC DataWeb dataset. They explain why standardizing the family weights is useful. They do not establish that product mix explains every difference, or that countries supply interchangeable goods within a family.
GIVE EVERY COUNTRY THE SAME BASKET
The standardized calculation takes each country’s observed rate in every family and weights it by that family’s share of the entire 57-family panel. Semiconductors receive the same weight for Malaysia, Japan and every other country in the comparison. So do engines, batteries, steel and all the remaining families.
Eligibility was set before comparing results. A country must have more than $1 billion of tracked customs value in 2025 and positive observations in every one of the 57 families. Twenty-seven countries qualify, producing 1,539 country-family observations. Missing rates are not filled with zero or borrowed from another country.
For Malaysia, replacing its own product weights with the common weights raises the synthetic rate to 12.22%. Japan’s moves to 10.92%. These numbers answer a conditional accounting question: what would each country’s observed family rates average to under an identical between-family distribution?
THE REVERSAL SURVIVES TWO ALTERNATE BASKETS
The choice of common weights could itself favor one country. To check that possibility, the analysis was repeated with the panel’s 2024 product shares instead of its 2025 shares. Malaysia remains higher, at 12.47% versus Japan’s 10.96%.
A second check gives every family equal weight. That is not a representative spending basket, but it is a useful stress test of the ranking. Malaysia comes out at 15.16%, Japan at 13.07%. All three common-weight comparisons reverse the ordering of the two raw country averages.
The actual numbers depend on the chosen basket, as they should. The claim is not that 12.22% is Malaysia’s one true tariff rate. The robust finding is that the raw country ranking does not survive a basic adjustment for between-family product composition.
CANADA AND MEXICO ALSO CHANGE PLACES
The same issue appears closer to home. Canada’s observed rate across the tracked families is 5.19%, compared with Mexico’s 4.87%. With the common 2025 basket, Canada is lower: 4.75% against 5.05%.
The order remains reversed using the 2024 basket, at 4.96% and 5.13%, and with equal-family weights, at 6.01% and 6.55%. This is a smaller difference than the Malaysia-Japan example, but it illustrates the same aggregation problem with a different pair of origins.
The reversals are part of a broader distribution, not a feature of every pair. Across the 27-country comparison, some observed positions barely change. Germany, for example, has a raw rate of 10.96% and a standardized rate of 10.92%. For that portfolio, this particular composition adjustment has little effect.
STANDARDIZATION REMOVES ONLY ONE LAYER
A family can contain many different products. Malaysia and Japan may export different semiconductor categories, different equipment specifications or different mixes of entries eligible for particular treatment. Giving the family the same weight does not make the products inside it identical.
The standardized rates therefore remain descriptive. They do not isolate legal treatment for a fixed shipment, identify the effect of a trade agreement, or show which supplier offers the lowest total cost. Actual procurement comparisons need matched goods, verified entry facts and the other costs of obtaining usable product.
Calculated duties also follow a statistical definition, rather than an audited record of final cash payments. The Census definitions are relevant to both the raw and standardized numbers. Adjusting weights cannot repair a mismatch between the question being asked and the meaning of the underlying measure.
START WITH THE COMPONENT, THEN LOOK UP THE COUNTRY
The practical failure exposed here is a reversed order of operations. A country-level average is selected first, then used to characterize an item. The more defensible comparison begins with the actual product and its entry conditions, with country aggregates supplying background context afterward.
For an analyst building a regional sourcing dashboard, showing both raw and common-basket rates makes the composition effect visible. The gap between them is a prompt to inspect what the country supplies, rather than an instruction to rewrite a supplier’s quote.
For a purchasing team, the relevant standard basket is ultimately its own matched purchasing requirement. Even then, the weights should be treated as a scenario until the item-level treatment and costs are verified. The national exercise supplies a clear warning: a low country average may describe the country’s export mix more than the goods a particular factory intends to buy.
Source window: 2025 rates and customs values, with 2024 weights used only for sensitivity. The annual snapshot was fetched September 6, 2026. All 27 countries have positive records in all 57 families; no country-specific unit prices are inferred.
Sources and evidence
Evidence period: 2025 country-family rates; 2025 and 2024 product baskets for sensitivity. The frozen evidence record lists the source files and verified hashes available September 9, 2026. Source revision: 5e4fb7726c3d40060c0151c086c903baae856cab. Later live-data updates do not alter the historical evidence in this article.
census.gov/foreign-trade/guide/sec2.html
Published 2026-09-29.