Manufacturing Economy
Manufacturing Regained Its Pre-Pandemic Level. Ten Industries Still Had Not.
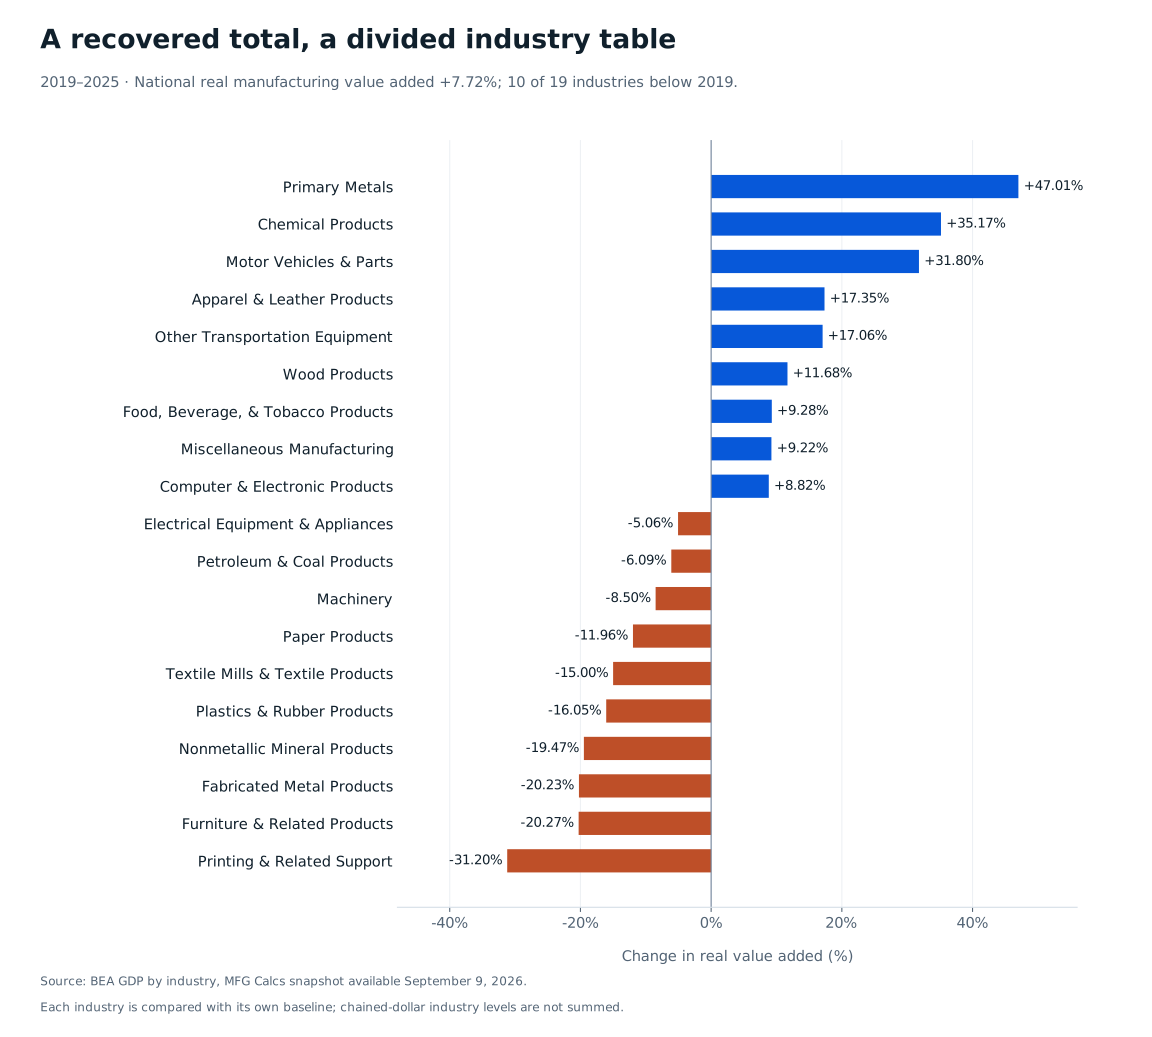
Real manufacturing value added was 7.72% above 2019 in 2025, while 10 of 19 detailed industries remained below 2019.
Editorial evidence cutoff: September 9, 2026. Published September 29, 2026. Observation periods are stated throughout; older figures are retrospective evidence.
A September 2026 manufacturing forecast needs to distinguish national recovery from the recovery of its own customers. The historical BEA panel available by September 9 offers a useful test: it compares 2019 with 2025, using the same nineteen detailed industries. This is a retrospective assessment of uneven recovery, not a report of newly released September production.
American manufacturing recovered beyond its pre-pandemic level. Many manufacturing industries did not. The distinction emerges when the national total is opened up: in the BEA series analyzed here, real manufacturing value added was 7.72% higher in 2025 than in 2019, but ten of nineteen detailed industries were still below their 2019 levels. The median industry had declined 5.06%.
That is an awkward result for anyone trying to describe the factory economy with one adjective. It also helps explain why a positive national report can feel disconnected from a supplier’s order book. The arithmetic permits both experiences. The total records the size of manufacturing activity; the industry table records how unevenly the recovery has been distributed. The underlying observations come from BEA’s GDP by industry accounts.
View full-size chart
Scroll horizontally to read every label. Keyboard users can focus the chart area and use the arrow keys.
THE RECOVERY LOOKS DIFFERENT WHEN EVERY INDUSTRY GETS A ROW
Printing and related support recorded a 31.20% real decline between 2019 and 2025. Furniture was down 20.27%, fabricated metals 20.23%, and nonmetallic mineral products 19.47%. Plastics and rubber, textiles, paper, machinery, petroleum and coal products, and electrical equipment also remained below the starting level. These are broad industry groups, not a selection of struggling individual companies.
The full nineteen-industry table matters because it prevents a particularly easy reporting error: choosing a few weak sectors and allowing them to stand for manufacturing as a whole. The opposite error is equally possible. A few strong industries can dominate an account of recovery while obscuring how many others have not regained their earlier level. Showing every group forces both sides of the distribution into view.
THE STRONG INDUSTRIES ARE STRONG ENOUGH TO CHANGE THE HEADLINE
Primary metals’ real value added rose 47.01% over the same period. Chemicals rose 35.17%, motor vehicles and parts 31.80%, and other transportation equipment 17.06%. Computer and electronic products were up 8.82%. A manufacturer serving these markets has a different demand backdrop from one supplying printing equipment or furniture production.
These differences do not mean the nineteen industry growth rates should be averaged to reproduce manufacturing growth. The median treats each industry equally, whereas the published aggregate reflects their economic size and BEA’s chain-weighting methods. Nor should the underlying chained-dollar industry levels be added together as though they were ordinary current-dollar accounts. The national growth figure is taken directly from the published manufacturing series. The distribution is a separate description of breadth.
A DIFFERENT STARTING YEAR CHANGES THE COUNT, NOT THE UNEVENNESS
Any recovery story is vulnerable to its starting point. The obvious challenge is that 2019 may have been unusually strong for some industries and weak for others. Repeating the calculation from 2018 leaves nine of nineteen industries below their starting level in 2025. Ending the original comparison in 2024 also leaves nine below 2019. The exact claim that a majority remains below its baseline therefore depends on the chosen window.
That qualification is material. The defensible finding is a broad and persistent split, with the ten-of-nineteen count attached specifically to 2019–2025. The alternative counts qualify the principal comparison. The annual path adds another distinction: an industry can finish below its baseline after recovering and falling again, which is different from never having recovered.
“REAL” DOES NOT MEAN A COUNT OF PARTS LEAVING THE DOOR
The measure is real value added: production’s contribution after intermediate inputs, adjusted using BEA’s price and quantity methods. It is not a count of cars, tonnes of steel, machine hours, or finished components. It also differs from the Federal Reserve’s industrial-production index. Treating these measures as interchangeable can produce apparent contradictions that come from definitions rather than economic events.
Within an industry, changes in product mix, the relationship between output and purchased inputs, and statistical revisions can affect measured value added. Employment can move differently again. An industry may increase output per worker while reducing employment, or retain workers while production weakens. None of those possibilities cancels the recovery comparison; they determine which additional evidence is needed before describing a particular factory’s experience or assigning an explanation to the national pattern.
THE NATIONAL BENCHMARK CAN BE THE WRONG COMPARISON FOR A PLANT
Consider a fabricated-metal supplier whose sales have been flat since 2019. Comparing that business only with the 7.72% increase in total real manufacturing value added would suggest it is falling behind. Comparing it with its own industry’s 20.23% real decline raises a different question. The business may have gained relative position, although sales and value added still need to be reconciled before making that judgment.
That is an illustrative interpretation, not a finding about an actual company. The practical point is to build a benchmark from the industries customers buy from and sell into. A plant supplying several sectors may need a weighted customer-exposure table. Those weights should come from its own revenue or order history, with explicit dates, rather than from whichever national industry happens to make the strongest story.
THE NEXT INVESTIGATION HAS TO EXPLAIN THE SPLIT
The table identifies where further reporting should begin. For the industries still below 2019, the next questions concern physical production, employment, capacity, imported inputs, domestic purchases and changing product composition. For the strongest industries, the same questions test whether measured growth reflects a broad expansion or a smaller number of powerful segments. Those explanations cannot be recovered from a single pair of GDP observations.
For decisions at the September 9 cutoff, the historical split identifies where a national growth assumption most needs scrutiny. A supplier can compare its customer industries with the same nineteen-category panel, then use current orders and customer reports to test whether the earlier gap persisted. The panel provides the historical baseline; it does not supply the latest customer conditions.
Industry recovery is already a subject of serious research, including BEA and BLS work on industry-level production. The matched nineteen-industry panel adds a defined historical comparison and disclosed sensitivity tests. It supports a narrower, more useful conclusion than a declaration that manufacturing is uniformly booming or broken: the 2025 aggregate had recovered beyond 2019, while the detailed industries followed very uneven paths.
Sources and evidence
Evidence period: 2019–2025 annual; sensitivity to 2018 base and 2024 end. The frozen evidence record lists the source files and verified hashes available September 9, 2026. Source revision: 5e4fb7726c3d40060c0151c086c903baae856cab. Later live-data updates do not alter the historical evidence in this article.
apps.bea.gov/scb/issues/2025/04-april/0425-integrated-industry-level-production.htm
Published 2026-09-29.